
Fun With Market Math
The Averages Are Anything But Average
With two strong years behind us, there is one question on everyone’s mind. “What will the market do this year?” Typically, this is followed by, “When will the stock market crash?”
Both are fair questions.
Normally, financial people respond that the stock market averages about 10% per year. That is a true statement. But it is just one reference point. However, it reminds us of the story about the six-foot-tall man who drown trying to cross a river that averaged five feet deep.
Be careful when assessing averages and variability. Doing so will help investors make better decisions.
Since 1928, the S&P 500 has, indeed, averaged just under 10% per year.
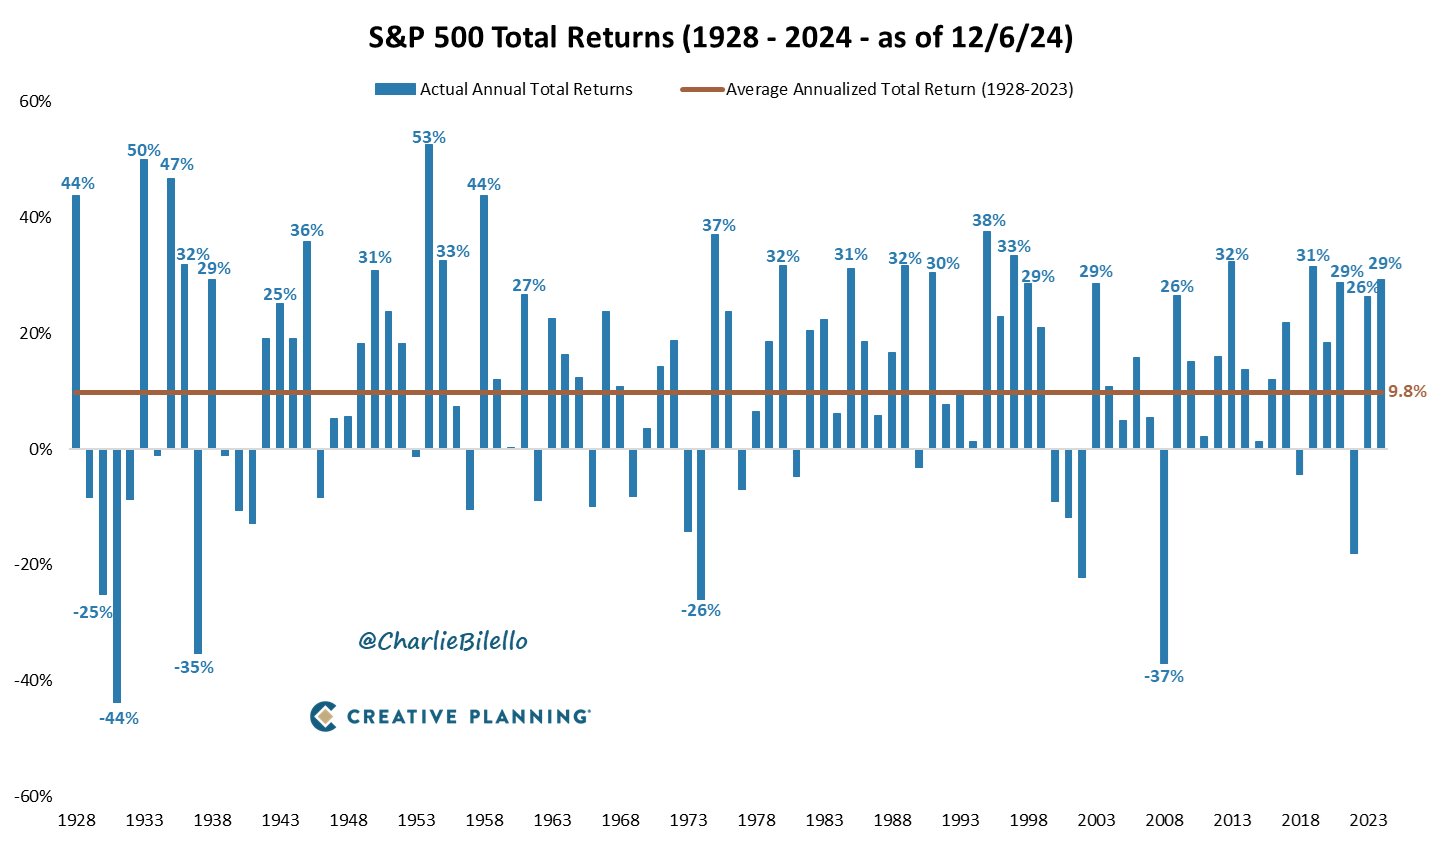
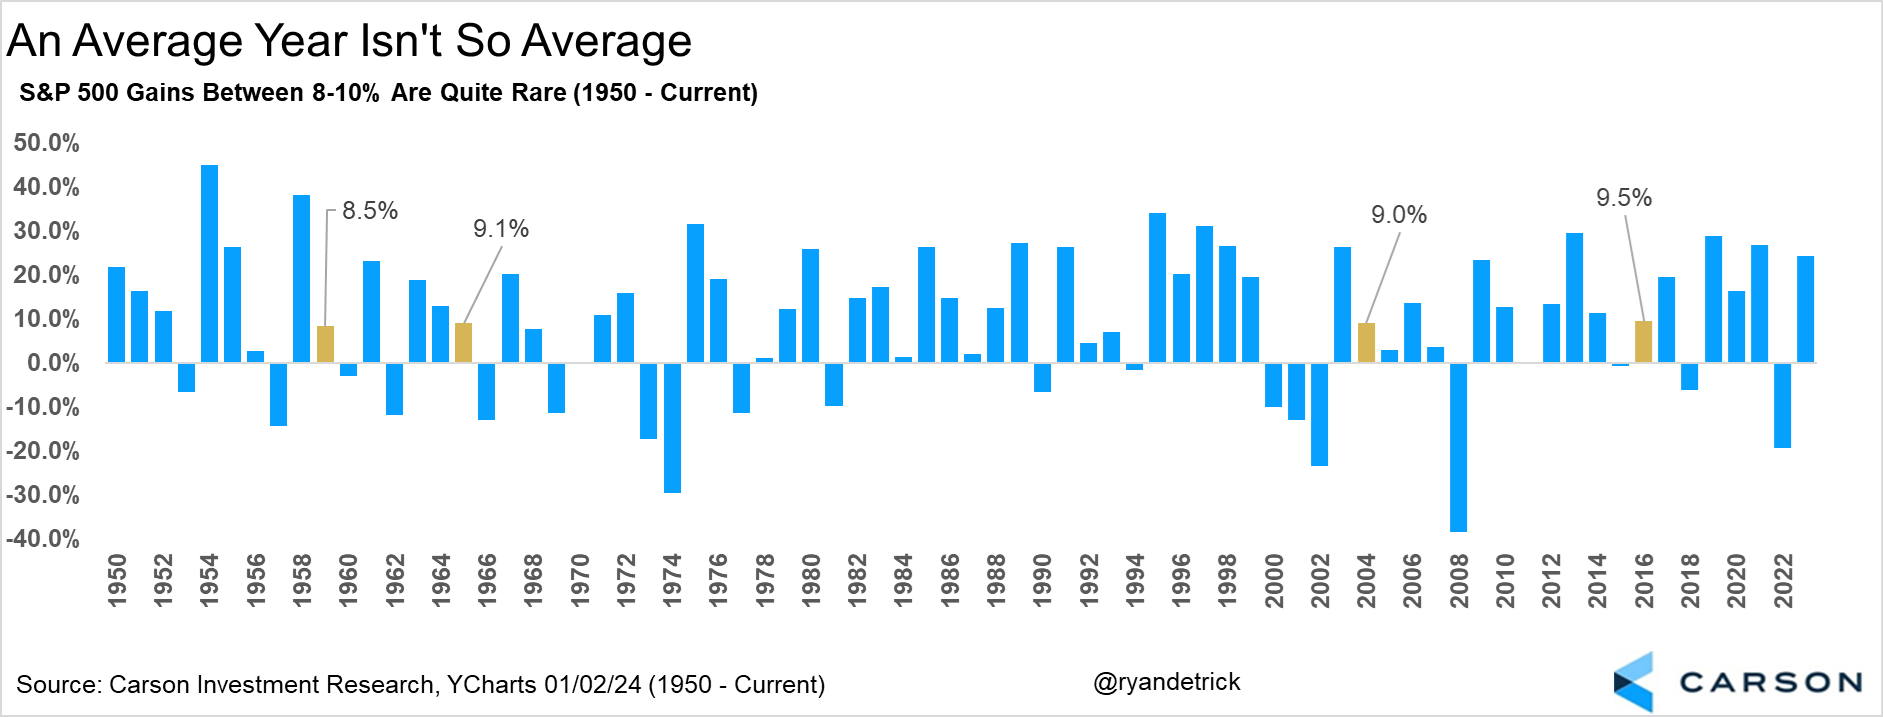
However, only four times over the last 74 years has the market produced returns of eight to ten percent. That means the “average” only happens five percent of the time. That should give investors an indication of how volatile the stock market is any given year.
For instance, over the last 74 years the stock market has gained as much as 52% in any single calendar year. Over the same period, the market has lost as much as 37%. At the extreme, that is nearly ninety points of variability in expected outcomes.
If you are a stock investor for just one year, hang on to your hat. Quite possibly, it will be a very bumpy ride.
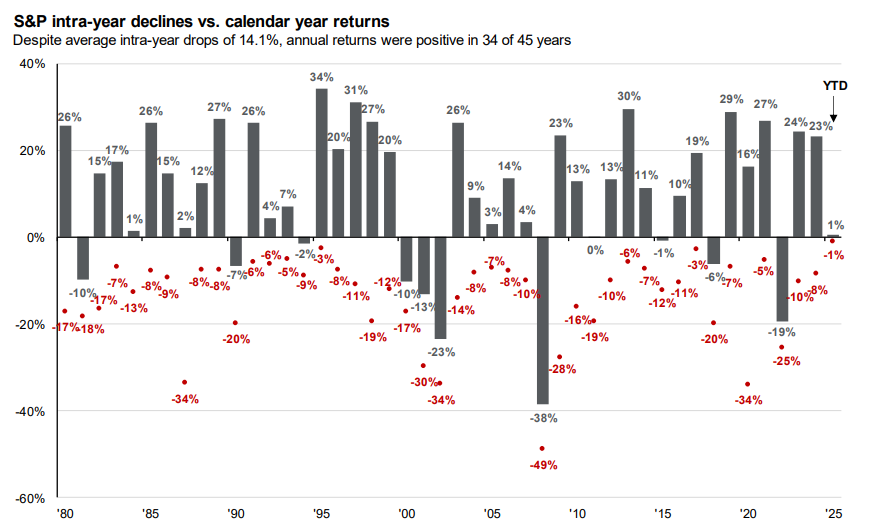
Investors can also learn a lot by studying volatility during the average year. Most people are surprised to learn that since 1980 the average intra-year drop is more than 14%.
Furthermore, over the last 96 years, the market has finished down 26 times, or 27% of the time. This negative return is what gets people’s attention. In assessing this data, only five times has the market fallen 25% or more for the entire year. As such, it happens but is rather rare.
Unfortunately, events such as the pandemic or the Great Recession are so frightening at the time, that we think a similar event is right around the corner each time the market hits an air pocket. Of course, the hype and spin of the media burn these impressions into our brains.
However, if you only focus on the negatives, you miss the opportunities. Despite the downside risks, over the same 96-year time frame the market has grown 25%, or more, 27% of the time. Another way of looking at this is that the markets are five times as likely to grow 25% than they are to fall by 25%. I’ll take those odds.
What can be learned from this market math?
- Despite the short-term volatility of the markets, they produce positive returns more than 75% of the calendar years.
- Averages can be very deceptive. To be a better investor, know what to expect at extremes and over different time periods.
- Be careful when taking Wall Street’s annual predictions. Historical data shows they are not good at making short-term predictions. For 2025, the market will most likely not deliver a 10% return. It may be higher or lower. But it is unlikely to be the average.
- The stock market is a liquidity mechanism. If you demand short-term liquidity from the stock market, expect very wild potential outcomes. Possibly you will be incredibly happy or profoundly disappointed.
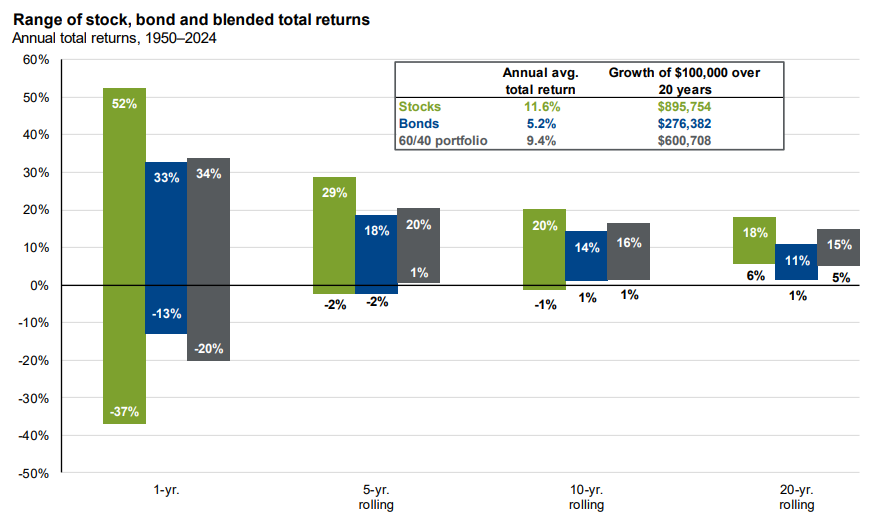
- Long-term, the stock market reflects the value of business earnings. Once you get to five year or longer averages, the volatility of the stock market smooths out and you are more likely to earn positive returns. As such, don’t own business’s for less than five years.
- I don’t know how the average person defines a “crash.” But psychologically, people equate it to being wiped out. The markets have never gone to zero.
- The market is expensive relative to history. However, companies are significantly more profitable than prior decades. Profit margins are at record highs. Unemployment is historically low, and inflation is below 3%. Gross Domestic Product (Total Sales of Goods and Services) for the US is growing at 2.4 percentage points above inflation. It will take something unexpected to deliver a market correction.
- The more you trade, the more likely you are to miss a big opportunity as opposed to sidestepping a decline.
Dave Sather is a Certified Financial Planner and the CEO of the Sather Financial Group, a fee-only strategic planning and investment management firm.
